GIS & Remote Sensing Projects
"LiDAR and UAS Photogrammetry for the 3D Modelling of Historical Landscapes - Whitespots-Conlig Lead Mine in Northern Ireland"
University of Aberdeen, GIS Dissertation Project 2018
For my dissertation project I wanted to explore the applications of open source LiDAR data sets and DJI's Phantom 3 Standard Quad-copter for the digital conservation of a 19th century Lead Mine. Focusing on the digital reconstruction of the mines remaining infrastructure which included; the Bog Shaft's Engine House, Chimney stack, and spoil heap, the South Shaft Chimney stack, and the Windmill Stump (used as a filming location for Game of Thrones). LiDAR generated Digital Elevation Models were imported in ArcGIS to be processed and interpreted. The resolution of the LiDAR DEMs was 1 metre, which produced low quality 3D models of the mines infrastructure, however, its ability to penetrate through vegetation allowed for the identification of mine shafts, quarries, areas of subsidence, and other hidden features. Using the Phantom 3, with its standard 12 MP camera, I carried out several nadir and oblique surveys of the lead mine and infrastructure. The photographs from the surveys were then processed and edited in Pix4D Mapper to produce 3D Photogrammetry models, DEMs, densified point clouds, and orthomosaics. This project showed that even with non-commercial equipment and open source data, its still possible to create detailed digital models for conservation purposes.
Whitespots-Conlig Lead Mine: -
Located in the hills above Newtownards, where the Whitespots and Conlig town lands meet, lays an abandoned 19th century Lead Mine. The Whitespots-Conlig Lead Mine was once the largest underground mine in Ireland, producing a total of 23,000 tons of lead ore before shutting down in 1865. The site was declared an Area of Special Scientific Interest (ASSI) in 1998, due to the lead mine's rare mineral assemblages, unusual diversity of plant species growing in spoil heaps and tailings, and its 19th century infrastructure. Today the lead mines are used as a country park and for outdoor recreational activities, which is causing severe erosion and damage to the paths, spoil heaps, tailings, rock outcrops, and buildings.
"Land-cover & Land-use Mapping of Knock Farm, Huntly, Scotland "
University of Aberdeen, Final Project in Web GIS Applications, 2018
University of Aberdeen, Final Project in Web GIS Applications, 2018
This project was carried out between two courses; WebGIS and UAV Remote Sensing, Monitoring and Mapping. It involved creating a precision agriculture company and undertaking a 12 week consultancy with a local farmer, Roger Polson, to produce remote sensing and GIS deliverables that would assist Roger in management decisions for Knock Farm. The following deliverables were proposed to the client: -
- An up-to-date Land-Cover/Land-Use map: To produce the LCLU Map the most recent sentinel-2 imagery of the area ( <10% cloud coverage) was obtained and then processed within ERDAS Imagine. A classification scheme was developed for Knock Farm and used for the supervised classification of the highest quality satellite image available. The classified image was used to create the most recent land-cover/land-use map of Knock Farm.
- A comprehensive geodatabase: Knock Farms field records (Field History, Grazing information, Manure Application, Managed Areas) were kept in paper format, these were digitised within ESRI's ArcMap to create a geodatabase. The farm operates a strict rotation pattern of crop and grazing animals, therefore the geodatabase was organised into separate feature classes ('Land Cover' & 'Grazing History') each containing the relevant data from the years 2015-2018.
- A WebGIS portal: The final deliverable was a WebGIS portal that the client could use to decide which crop or grazing animal is next in the rotation for each field based on the fields history. Using the Online GIS platform 'Mango Map', the geodatabase files were uploaded and displayed as an interactive series of maps. The client is able to access all of the data for an individual field, update records, plan rotation patterns for years in advance, and share this information with relevant users.

"Mapping Lahar Pathways and Identifying High-Risk Slopes on Mount Baker, Washington, US"
University of Aberdeen, Final Project for Current Applications of GIS, 2018
My final project for Current Applications of GIS, I wanted to explore the applications of ESRI's ArcMap & ArcScene for identifying dangerous slopes and the potential pathways of lahars (mud/debris flow) on an active glaciated volcano. I selected Mount Baker as the study area for the following reasons; The volcanic deposits around Mount Baker show that during eruption events it frequently produces destructive lahars, Closest settlement is within 17 miles, It is the second most glaciated volcano in the Cascade Range, The USGS elevated its threat potential level to "Very High", and it has been showing signs of volcanic activity since 1975, however monitoring by the USGS has decreased. For this project I gathered Digital Elevation Models (DEM) and aerial orthophotographs from the United States Geological Survey's (USGS) opensource geospatial database (The National Map). These data sets were processed, analysed and interpreted within ArcMap & ArcScene to produce a 3D model of the volcano, complete with a photo-realistic surface, and digitised lahar pathways and high-risk slopes. The results show that the slopes with the highest risk of producing lahars are located on the northwestern Roosevelt Glacier and the southeastern Talum Glacier. Hydrological analysis of the 3D model shows that potential lahars would most likely follow the existing deep valleys and river channels, that surround the base of Mount Baker. These findings show that the towns and cities immediately to the west of the volcano are most at risk from lahars, in the event of an eruption. Coupling this with the fact that Mount Baker is a popular recreation area, this study suggests that the volcanoes current monitoring system should be updated and enhanced. Further research into modelling the flow rate and behaviour of lahars would be useful for predicting lahar arrival times for evacuation planning in nearby towns.
"Using Remote Sensing and GIS Techniques for identifying a suitable location for a river dam site, within the Italian Alps"
University of Aberdeen, Project for Fundamentals and Advanced Applications of Map Algebra, 2018
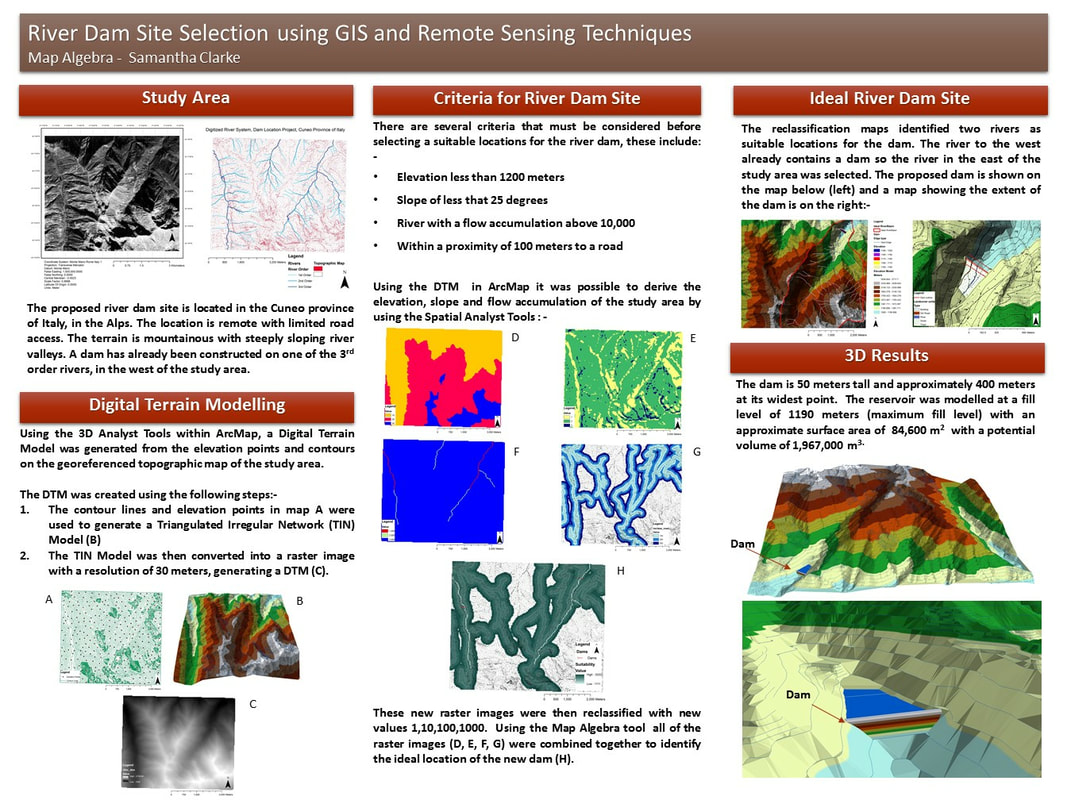
This project involved using map algebra and ArcGIS to identify a suitable location for a new River Dam based on the following criteria; an elevation of less that 1200 meters, a slope of less than 25 degrees, the river flow has to be above 10, 000 cubic feet per second, and located within 100 meters of a road.
Using a topographic map of the area, an aerial images was georeferenced and rectified. The next step was to use both the map and aerial image to digitise the roads, buildings, and rivers. After this a Triangulated Irregular Network (TIN) model was generated from the contour lines of the topographic map and then converted into a Digital Terrain Model (DTM). Using the spatial analysis tools with ArcGIS the slope, elevation, hydrology, and road proximity were calculated from the DTM.
The final step was to take all of the individual criteria layers and reclassify them using map algebra, to create one combined layer that showed the best location for a new river dam.
University of Aberdeen, Project for Fundamentals and Advanced Applications of Map Algebra, 2018
This project involved using map algebra and ArcGIS to identify a suitable location for a new River Dam based on the following criteria; an elevation of less that 1200 meters, a slope of less than 25 degrees, the river flow has to be above 10, 000 cubic feet per second, and located within 100 meters of a road.
Using a topographic map of the area, an aerial images was georeferenced and rectified. The next step was to use both the map and aerial image to digitise the roads, buildings, and rivers. After this a Triangulated Irregular Network (TIN) model was generated from the contour lines of the topographic map and then converted into a Digital Terrain Model (DTM). Using the spatial analysis tools with ArcGIS the slope, elevation, hydrology, and road proximity were calculated from the DTM.
The final step was to take all of the individual criteria layers and reclassify them using map algebra, to create one combined layer that showed the best location for a new river dam.
More projects coming soon...
